Phishing Click Rate Statistics 2026: How Often Employees Fail Phishing Tests
CyberReviewed Research Desk ·
Phishing emails pretend to come from a colleague, a delivery company or the IT department, and try to get an employee to click a link or hand over a password. Victims filed more than 190,000 phishing and spoofing complaints with the FBI in 2025. Many US companies now train staff to spot these messages by sending them fake phishing emails and tracking who falls for them, and the results vary with how employees are tested.
We wanted to know how much that training changes behavior.
Our analysts used KnowBe4's 2026 Phishing by Industry Benchmarking Report. It covers more than 42 million simulated phishing emails sent to 14.8 million employees at 64,000 organizations. We took its failure rates before training, after 90 days and after a year, for North America by company size and worldwide by industry. We compared them with click rates from Verizon's 2026 Data Breach Investigations Report and with cost and loss figures from IBM and the FBI.
In the following sections, we look at how many employees fail phishing tests before and after training, how the rate changes with company size and industry, why different studies report very different click rates, and what successful phishing costs.
One in three employees fails a first test
KnowBe4 measures what it calls the phish-prone percentage, defined as "the percentage of employees within an organization likely to fall for social engineering or phishing attacks."1 In North America, 34.5% of employees failed a baseline test before any training. After 90 days of training and testing, the rate fell to 20.2%, and after a year it was 4%.1 Worldwide, the baseline was 33.2%, falling to 20.1% at 90 days and 4.2% after a year.1
- Training cut the North American failure rate from 34.5% to 4% within a year, a drop of about 88%.
- The rate fell 14.3 points in the first 90 days and another 16.2 points by the end of the year.
- A program judged at the 90-day mark misses more than half of the improvement. A full year shows the full effect.
Larger organizations start out more exposed
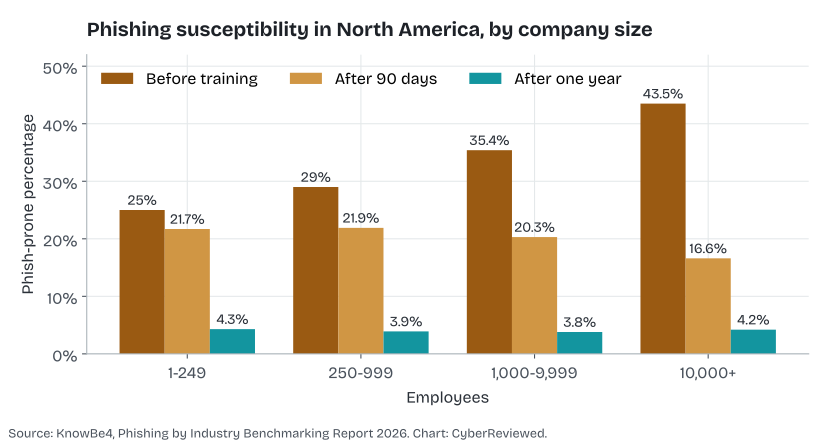
The baseline rate climbs steadily with headcount. At North American organizations with 10,000 or more employees, 43.5% of staff failed an initial test, compared with 25% at organizations with fewer than 250.1 After a year of training the gap all but disappears, with every size band at or near 4%.
| Employees | Baseline | After 90 days | After one year |
|---|---|---|---|
| 1 to 249 | 25.0% | 21.7% | 4.3% |
| 250 to 999 | 29.0% | 21.9% | 3.9% |
| 1,000 to 9,999 | 35.4% | 20.3% | 3.8% |
| 10,000 or more | 43.5% | 16.6% | 4.2% |
- The largest organizations started 18.5 points higher than the smallest.
- They also improved fastest. At 90 days, organizations with 10,000 or more employees were at 16.6%, the lowest of any size band.
- After a year every size band was between 3.8% and 4.3%. Large employers start with the most staff at risk and gain the most from a first year of training.
Healthcare employees are the most susceptible
Across all regions, healthcare and pharmaceutical organizations had the highest baseline rate at 42.7%, followed by insurance at 38.1% and retail at 36%.1 In North America, the healthcare baseline reached 44%, and 54.9% at healthcare organizations with 10,000 or more employees. After a year of training, those large healthcare organizations were at 3%. Banking finished the year lowest of any North American industry, at 2.8%.1 Healthcare also has the highest average breach cost of any industry in IBM's data, at $6.64 million in 2026.3
| Industry | Baseline |
|---|---|
| Healthcare and pharmaceuticals | 42.7% |
| Insurance | 38.1% |
| Retail and wholesale | 36.0% |
- The healthcare baseline of 42.7% was 9.5 points above the worldwide average of 33.2%.
- Large North American healthcare organizations fell from 54.9% to 3% in a year, a drop of 51.9 points.
- Industries that start with the highest failure rates have the most to gain from training. In healthcare, a year of training brought large organizations below the North American average of 4%.
KnowBe4 also publishes results by industry for each company size. At organizations with 10,000 or more employees, baseline rates were higher than the all-size averages in most industries, and nearly every industry fell below 5% after a year.1
| Industry | Baseline | After 90 days | After one year |
|---|---|---|---|
| Healthcare and pharmaceuticals | 54.0% | 17.0% | 3.8% |
| Nonprofit | 48.8% | 21.1% | 6.3% |
| Insurance | 48.4% | 17.3% | 4.7% |
| Retail and wholesale | 46.4% | 18.1% | 4.3% |
| Banking | 44.6% | 11.4% | 3.0% |
| Financial services | 42.4% | 14.8% | 4.0% |
| Manufacturing | 38.8% | 16.1% | 3.4% |
| Technology | 38.8% | 14.0% | 4.6% |
| Energy and utilities | 38.7% | 17.0% | 7.1% |
| Business services | 36.6% | 16.2% | 5.0% |
| Consulting | 36.4% | 23.4% | 3.3% |
| Education | 34.3% | 16.8% | 4.6% |
| Construction | 31.6% | 21.8% | 6.2% |
| Hospitality | 30.5% | 16.0% | 2.6% |
| Government | 30.0% | 15.0% | 4.3% |
| Transportation | 28.1% | 16.3% | 8.9% |
| Legal | 26.2% | 12.4% | 2.4% |
| Consumer services | 22.6% | 13.0% | 3.9% |
- Six of the 18 industries started above 40% in this size band, led by healthcare at 54%.
- Banking had the lowest 90-day rate at 11.4%. Transportation finished the year highest at 8.9%.
- Large employers in transportation, energy, nonprofits and construction ended the year above 6%. In those industries, one year of training left more than twice the rate seen in legal or hospitality.
Why click rates vary so much between studies
Verizon's 2026 Data Breach Investigations Report found a median click rate of 1.4% in email phishing simulations, with phone-based lures at about 2%, roughly 40% higher.2 That figure is far lower than KnowBe4's baseline because the two measure different things. Verizon's figure is a median across organizations running simulation programs, while KnowBe4's baseline captures employees who have never been trained.
The human element remains central to breaches. Verizon found it present in 62% of breaches, up from 60%, with phishing the initial access vector in 16% of breaches and pretexting in 6%.2 Exploited vulnerabilities, at 31% of initial access, now outrank phishing as an entry point in Verizon's data.2
What successful phishing costs
IBM's 2026 study found phishing to be the most common initial vector for the fourth straight year. Breaches that began with voice or text message phishing averaged $5.29 million, and those that began with social engineering $5.23 million.3
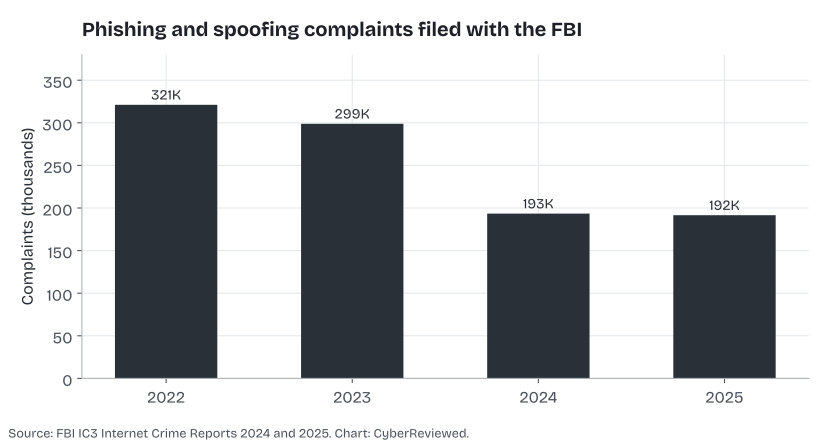
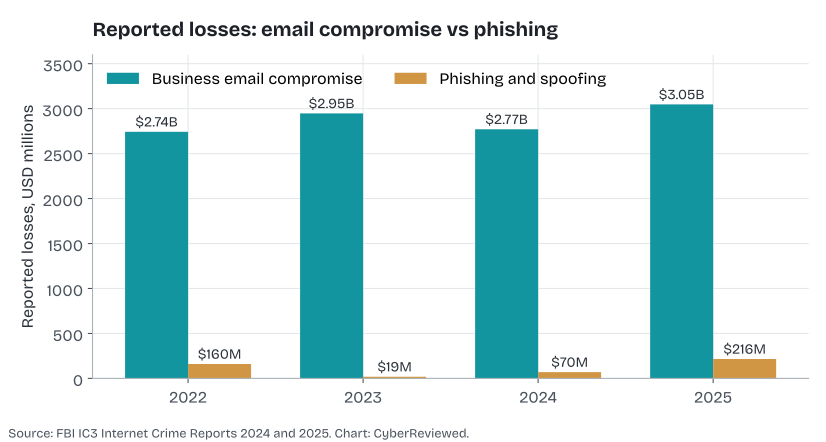
Complaints to the FBI about phishing and spoofing fell from 321,136 in 2022 to 191,561 in 2025, but reported losses from them rose to $215.8 million in 2025.45 Business email compromise, which usually begins with a deceptive message, remains the costlier crime: 24,768 complaints in 2025 reported $3.05 billion in losses.4
| Year | Phishing and spoofing complaints | Phishing losses | BEC complaints | BEC losses |
|---|---|---|---|---|
| 2022 | 321,136 | $160.0M | 21,832 | $2.74B |
| 2023 | 298,878 | $18.7M | 21,489 | $2.95B |
| 2024 | 193,407 | $70.0M | 21,442 | $2.77B |
| 2025 | 191,561 | $215.8M | 24,768 | $3.05B |
- Phishing and spoofing complaints fell 40% from 2022 to 2025, while reported phishing losses rose 35%.
- BEC losses were about 14 times phishing losses in 2025.
- Payment fraud is the costliest outcome of a deceptive email in this data. Losses averaged about $123,000 per BEC complaint in 2025, against about $1,100 per phishing complaint.
What the figures mean for training programs
For a North American company with 1,000 employees, the KnowBe4 rates mean roughly 345 people falling for a first simulated phishing email, and about 40 after a year of training.
Attackers are also moving to phone calls and text messages, where Verizon found simulated lures succeed about 40% more often than email, and in Verizon's data more breaches now begin with an exploited vulnerability than with phishing.
So if you run a training program, measure your own baseline failure rate before training and again after a year, since that is the change the KnowBe4 data tracks.
Sources
Methodology
Phish-prone percentages come from KnowBe4's 2026 Phishing by Industry Benchmarking Report. Baseline figures reflect results before any training; 90-day and one-year figures reflect organizations that continued training and simulated phishing. The report's North America section table is used for size bands; figures elsewhere in the report differ slightly and are not mixed here. The industry table for organizations with 10,000 or more employees is KnowBe4's worldwide table for that size band, which excludes the "Other" category shown in the report. Click rate and initial access figures come from Verizon's 2026 Data Breach Investigations Report. Cost figures come from IBM's Cost of a Data Breach 2026. Complaint and loss figures come from the FBI IC3 annual reports for 2024 and 2025, which reflect only complaints filed by victims. All money is in US dollars.