Data Breach Cost Statistics 2026: What a Breach Costs a US Company
CyberReviewed Research Desk ·
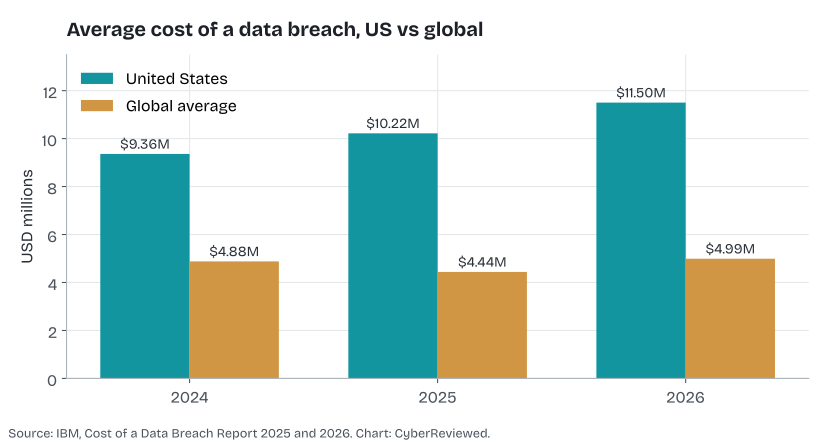
When a US company is breached, it pays for investigators and lawyers, for letters and call centers to notify customers, and later for the customers and business it loses. IBM's yearly study adds those costs up, and its 2026 edition puts the US average higher than in any other country or region it measures. The dollar gap between the US and global averages has widened in each of the last two years.
So we looked at how wide the gap has become, and at what makes a single breach more expensive.
Our analysts compared the US and global averages in the 2024, 2025 and 2026 editions of IBM's Cost of a Data Breach report. The 2026 study, conducted by the Ponemon Institute, covers 602 organizations that were breached. We also used the report's tables on costs by industry, country, attack method, data type and use of security AI, and its figures on how long breaches take to find and contain. To check the direction of US losses against a second source, we added the losses victims reported to the FBI's Internet Crime Complaint Center.
In the following sections, we look at the US average against the global figure, compare costs by industry and country, track how long breaches take to contain, examine which attack methods produce the most expensive incidents, and show how AI and the type of data stolen affect the cost.
The US average is more than double the global figure
IBM's 2026 study puts the average cost of a breach at a US organization at $11.50 million, up from $10.22 million in 2025 and $9.36 million in 2024.12 Over the same period the global average moved from $4.88 million to $4.44 million and back up to $4.99 million, so the dollar gap between the two has widened in each of the last two years.
| Year | United States | Global average | US multiple of global |
|---|---|---|---|
| 2024 | $9.36 | $4.88 | 1.9x |
| 2025 | $10.22 | $4.44 | 2.3x |
| 2026 | $11.50 | $4.99 | 2.3x |
- The US average rose $2.14 million in two years, while the global average rose $0.11 million. Almost all of the widening gap came from higher US costs.
- The US figure was about 2.3 times the global average in both 2025 and 2026. In 2024 it was 1.9 times.
- A US company that budgets from the $4.99 million global figure covers less than half of the $11.50 million US average. For US planning, the global number understates the typical loss.
The 2025 dip interrupted a long rise. IBM's long-run averages rose from $3.92 million in 2019 to $4.88 million in 2024 before the dip, and the 2026 figure of $4.99 million is the highest in the series.1
Costs by industry and country
Healthcare has led IBM's industry ranking for years, and it still does, although its average fell 10.5% in 2026. Financial services came next, followed by industrial companies and technology firms, tied at $5.50 million. Every other industry in the table became more expensive.1
| Industry | 2025 | 2026 | Change |
|---|---|---|---|
| Healthcare | $7.42 | $6.64 | -10.5% |
| Financial | $5.56 | $6.29 | +13.1% |
| Industrial | $5.00 | $5.50 | +10.0% |
| Technology | $4.79 | $5.50 | +14.8% |
| Entertainment | $4.43 | $5.38 | +21.4% |
| Pharmaceuticals | $4.61 | $5.25 | +13.9% |
| Energy | $4.83 | $5.24 | +8.5% |
| Services | $4.56 | $5.08 | +11.4% |
| Communications | $3.75 | $4.71 | +25.6% |
| Public sector | $2.86 | $3.50 | +22.4% |
- Healthcare was the only industry in the table whose average fell. It still cost more per breach than any other industry, at $6.64 million.
- Communications and the public sector rose fastest, by 25.6% and 22.4%. The public sector remains the least expensive industry in the table at $3.50 million.
- These are worldwide averages. The US average of $11.50 million is higher than every industry figure in the table, so a US company in any industry faces costs well above these numbers.
Outside the US, the Middle East had the highest regional average at $8.00 million, followed by the Benelux countries at $7.37 million and Canada at $5.20 million. Germany rose from $4.03 million to $4.93 million, while the United Kingdom was nearly flat at $4.17 million.1
| Country or region | 2025 | 2026 |
|---|---|---|
| United States | $10.22 | $11.50 |
| Middle East | $7.29 | $8.00 |
| Benelux | $6.24 | $7.37 |
| Canada | $4.84 | $5.20 |
| Germany | $4.03 | $4.93 |
| Latin America | $3.81 | $4.65 |
| United Kingdom | $4.14 | $4.17 |
| Italy | $3.44 | $4.12 |
- The US average is $3.50 million higher than that of the Middle East, the next most expensive region.
- After the US, Benelux had the largest dollar increase, at $1.13 million. The UK rose by only $0.03 million.
- On these averages, a breach at a company's US operations costs the most. The UK average of $4.17 million is little more than a third of the US figure.
Breaches are taking longer to contain again
The average breach lifecycle lengthened to 247 days in 2026 from 241 days, with 183 days to identify the breach and 64 days to contain it. IBM says the increase reversed a five-year decline.1 Breaches that took longer than 200 days to identify and contain cost an average of $5.65 million, compared with $4.32 million for shorter ones.1
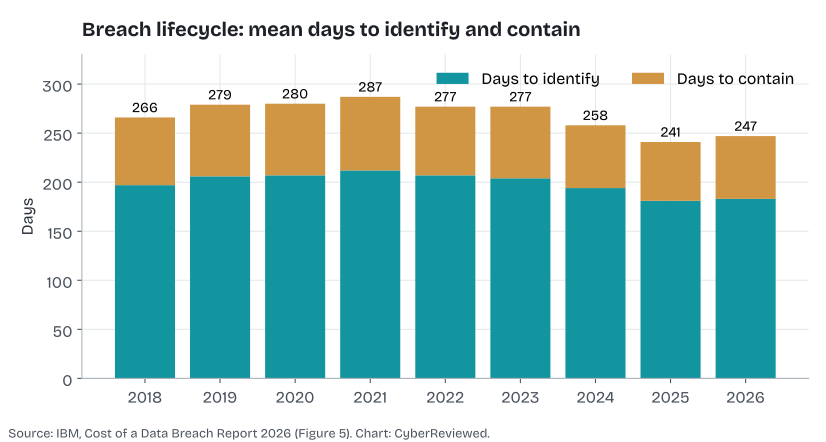
- Breaches that ran past 200 days cost $1.33 million more on average than shorter ones.
- Finding a breach took 183 days in 2026, nearly three times the 64 days it took to contain one.
- Detection is where most of the time goes. A company that shortens the time to find a breach shortens most of the lifecycle.
Which attacks cost the most
Phishing was the most common initial attack vector for the fourth straight year in IBM's 2026 data, and it also produced the most expensive breaches.1
| Initial attack vector | Share of breaches | Average cost, USD millions |
|---|---|---|
| Phishing (voice or SMS) | 17% | $5.29 |
| Social engineering (help desk impersonation, MFA fatigue) | 13% | $5.23 |
| External remote services | Not stated | $5.11 |
| Abusing valid accounts | 13% | $5.07 |
| Drive-by compromise | 13% | $4.99 |
| Supply chain compromise | Second most common | $4.96 |
| Replication through removable media | Nearly 10% | $4.73 |
| Exploiting public-facing applications | Not stated | $4.68 |
- Voice and SMS phishing cost $0.61 million more per breach than exploiting public-facing applications, the cheapest vector in the table.
- The two most expensive vectors, phishing and social engineering, both work by impersonating someone the victim trusts.
- Copying data to removable media still appeared in nearly 10% of breaches.
Malicious attacks caused 55% of breaches overall, and 39% of breached organizations were also hit by ransomware, compared with 24% in 2023.1
FBI complaint data offers a narrower but independent view of US losses. Complaints classified as data breaches reported $435.2 million in losses in 2025, and personal data breaches another $1.31 billion.3 Those figures capture only what victims chose to report to the FBI, so they sit well below the full cost that IBM measures, but the direction is similar.
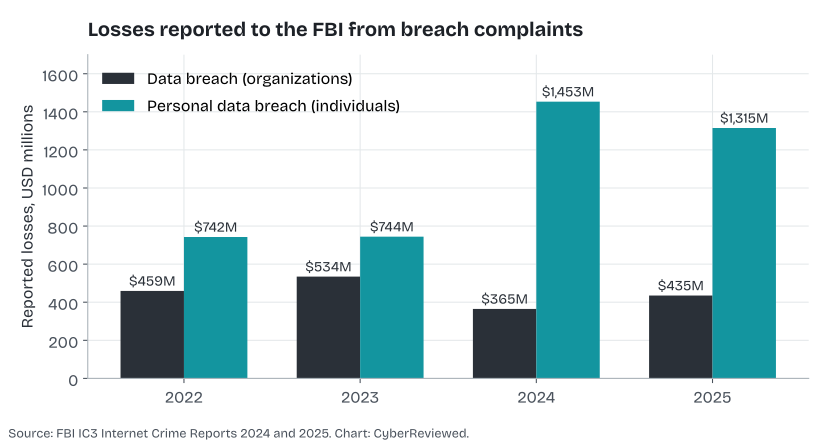
Across all crime types, losses reported to the FBI reached $20.9 billion in 2025 from just over 1 million complaints, up from $16.6 billion in 2024 and $6.9 billion in 2021.34
- Victims reported $1.75 billion in combined data breach and personal data breach losses to the FBI in 2025. That is about 8% of the $20.9 billion reported across all crime types.
- All data breach complaints to the FBI in 2025 reported $435.2 million combined, while IBM puts the average cost of a single US breach at $11.50 million. Most breach costs never reach the FBI's figures.
- Reported FBI losses are a minimum. IBM's per-breach averages are the better basis for budgeting.
AI, data type and the cost of a breach
IBM's 2026 study found that more than one in four organizations hit by a malicious attack said the attack was AI-driven, a 56% increase over the previous year. Those AI-driven attacks added an average of $1 million to the cost of a breach.1 Security incidents involving shadow AI, meaning AI tools that employees use without approval, more than doubled to 43% from 20%, and breaches involving shadow AI averaged $5.39 million, up from $4.63 million.1
AI also lowered costs for defenders. Organizations that used security AI and automation extensively averaged $4.00 million per breach, against $5.93 million for those that did not use them, a saving of $1.93 million. Extensive users also found and contained breaches in 215 days, 65 days faster than non-users. Only 36% of the organizations studied used these tools extensively.1
| Use | Share, 2026 | Cost, 2025 | Cost, 2026 | Days, 2026 |
|---|---|---|---|---|
| Extensive use | 36% | $3.62 | $4.00 | 215 |
| Limited use | 39% | $4.28 | $5.05 | 244 |
| No use | 25% | $5.52 | $5.93 | 280 |
- Days are the average time to identify and contain a breach.
- Extensive users saved $1.93 million per breach compared with non-users in 2026. Limited users saved $0.88 million.
- Breach costs rose at every level of AI use from 2025 to 2026.
- Nearly two-thirds of organizations, 64%, made limited or no use of security AI and automation.
The type of data stolen also changes the bill. Customer personal information was the most common target, taken or exposed in 52% of breaches, and IBM puts its cost at $192 per record.1
| Type of data | Share, 2026 | Per record, 2025 | Per record, 2026 |
|---|---|---|---|
| Intellectual property | 32% | $178 | $196 |
| Customer personal information | 52% | $160 | $192 |
| Employee personal information | 35% | $168 | $188 |
| Other corporate data | 24% | $154 | $179 |
| Anonymized customer data | 34% | $115 | $130 |
- Intellectual property was the costliest data type at $196 per record.
- The cost of a customer personal information record rose $32, or 20%, from 2025.
- Every data type in the table cost more per record than in 2025.
What the figures mean for US companies
The global average is less than half the US figure in IBM's data, so a plan built on it leaves a US company short of the cost of an average breach.
Detection time also affects cost. Breaches that ran past 200 days cost more in IBM's study, and the average lifecycle grew in 2026.
So if you are setting a cyber insurance limit for a US company, start from the US average of $11.50 million instead of the global figure of $4.99 million.
Sources
Methodology
US and global averages come from the IBM Cost of a Data Breach reports for 2025 and 2026, conducted by the Ponemon Institute. The 2024 US average is taken from the 2025 edition. Industry, country, attack vector, cost per record and security AI figures are the 2026 study's published averages, with 2025 comparisons as printed in the same tables. Where IBM's text gives an attack vector's share of breaches it is shown; IBM's chart plots the others without printing a figure. Percentage changes are calculated from the published figures and rounded to one decimal place. Lifecycle figures are IBM's mean days to identify and contain. FBI figures come from the IC3 annual Internet Crime Reports and reflect complaints filed by victims; they are not comparable to IBM's per-breach cost estimates and are shown for direction only. All money is in US dollars.